18th Congress: Pennsylvania 1822
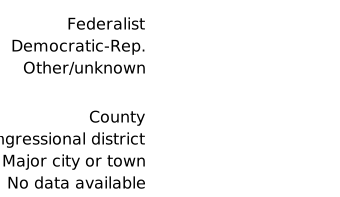
This page includes an interactive map. A text version of the same election data is available in the table below the map.
Pennsylvania elected eight Federalists and eighteen Democratic-Republicans to the Eighteenth Congress.
The map for this election is incomplete due to the lack of returns for some counties.
Following the 1820 Census, Pennsylvania gained three more seats in the House of Representatives.
Pennsylvania used a district system for electing members to Congress. Each district elected one member of Congress except Districts 4 and 9, which each elected three members, and Districts 7, 8, 11, and 16, which each elected two members. The votes cast in Lycoming, Potter, and McKean counties were reported as one unit.
In 1824, a special election was held in which George Wolf was elected to replace Thomas J. Rogers, who had resigned from office.
In 1824, a special election was held in which Alexander Thomson was elected to replace John Tod, who had resigned from office.
| District | Candidate | Party | Vote | Percentage | Elected |
|---|---|---|---|---|---|
| 1 | Samuel Breck | Federalist | 1,083 | 52.5% | ✓ |
| 1 | Joel B. Sutherland | Democratic-Republican | 892 | 43.3% | |
| 2 | Joseph Hemphill | Federalist | 2,268 | 58.9% | ✓ |
| 2 | George M. Dallas | Democratic-Republican | 1,367 | 35.5% | |
| 2 | Other candidates | 218 | 5.6% | ||
| 3 | Daniel H. Miller | Democratic-Republican | 2,891 | 65.8% | ✓ |
| 3 | Thomas Forrest | Federalist | 1,500 | 34.2% | |
| 4 | James Buchanan | Federalist | 7,021 | 18.7% | ✓ |
| 4 | Isaac Wayne | Federalist | 6,870 | 18.3% | ✓ |
| 4 | Samuel Edwards | Federalist | 6,839 | 18.2% | ✓ |
| 4 | William Darlington | Democratic-Republican | 5,723 | 15.2% | |
| 4 | William Anderson | Democratic-Republican | 5,646 | 15% | |
| 4 | Jacob Hibshman | Democratic-Republican | 5,539 | 14.7% | |
| 5 | Philip S. Markley | Democratic-Republican | 2,022 | 52.5% | ✓ |
| 5 | John Hughes | Federalist | 1,829 | 47.5% | |
| 6 | Robert Harris | Democratic-Republican | 2,476 | 54.6% | ✓ |
| 6 | John Phillips | Federalist | 2,057 | 45.4% | |
| 7 | Daniel Udree | Democratic-Republican | 4,183 | 28.9% | ✓ |
| 7 | Henry Wilson | Democratic-Republican | 3,962 | 27.4% | ✓ |
| 7 | Ludwig Worman | Federalist | 3,213 | 22.2% | |
| 7 | Peter Rhoads | Federalist | 3,109 | 21.5% | |
| 8 | Samuel D. Ingham | Democratic-Republican | 5,417 | 34.5% | ✓ |
| 8 | Thomas J. Rogers | Democratic-Republican | 4,629 | 29.5% | ✓ |
| 8 | Samuel Sitgreaves | Federalist | 3,740 | 23.8% | |
| 8 | Francis B. Shaw | Federalist | 1,907 | 12.2% | |
| 9 | William Cox Ellis | Federalist | 6,398 | 18.1% | ✓ |
| 9 | Samuel MacKean | Democratic-Republican | 6,137 | 17.4% | ✓ |
| 9 | George Kremer | Democratic-Republican | 6,103 | 17.3% | ✓ |
| 9 | Joseph Woods | Democratic-Republican | 5,897 | 16.7% | |
| 9 | Henry Welles | Federalist | 5,290 | 15% | |
| 9 | Henry Yearick | Federalist | 3,697 | 10.5% | |
| 9 | Other candidates | 1,813 | 5.1% | ||
| 10 | James S. Mitchell | Democratic-Republican | 1,478 | unopposed | ✓ |
| 11 | John Findlay | Democratic-Republican | 5,262 | 27% | ✓ |
| 11 | James Wilson | Democratic-Republican | 4,933 | 25.3% | ✓ |
| 11 | James MacSherry | Federalist | 4,713 | 24.2% | |
| 11 | William N. Irvine | Federalist | 4,598 | 23.6% | |
| 12 | John Brown | Democratic-Republican | 5,371 | unopposed | ✓ |
| 13 | John Tod | Democratic-Republican | 4,166 | unopposed | ✓ |
| 14 | Andrew Stewart | Democratic-Republican | 2,889 | 60.8% | ✓ |
| 14 | Joseph Huston | Federalist | 1,865 | 39.2% | |
| 15 | Thomas Patterson | Democratic-Republican | 1,745 | 67.8% | ✓ |
| 15 | Walter Craig | Federalist | 830 | 32.2% | |
| 16 | Walter Forward | Federalist | 4,420 | 30.2% | ✓ |
| 16 | James Allison, Jr. | Federalist | 4,123 | 28.2% | ✓ |
| 16 | John A. Scroggs | Democratic-Republican | 3,118 | 21.3% | |
| 16 | Joel Lewis | Democratic-Republican | 2,960 | 20.2% | |
| 17 | George Plumer | Democratic-Republican | 3,073 | 54.1% | ✓ |
| 17 | Alexander W. Foster | Federalist | 2,606 | 45.9% | |
| 18 | Patrick Farrelly | Democratic-Republican | 3,277 | 71.4% | ✓ |
| 18 | Samuel Williamson | Democratic-Republican | 1,312 | 28.6% |
In most cases, only candidates who received more than 5 percent of the vote in a district are reported. Other candidates are reported as a group, but only if they in aggregate received more than 5 percent of the vote. In addition, percentages for each district may not add up to 100 percent due to rounding. The term Dissenting Republican includes various breakaway factions of the Democratic-Republican party.
New Nation Votes Data
- PA US Congress 1822 District 1
- PA US Congress 1822 District 2
- PA US Congress 1822 District 3
- PA US Congress 1822 District 4
- PA US Congress 1822 District 5
- PA US Congress 1822 District 6
- PA US Congress 1822 District 7
- PA US Congress 1822 District 8
- PA US Congress 1822 District 9
- PA US Congress 1822 District 10
- PA US Congress 1822 District 11
- PA US Congress 1822 District 12
- PA US Congress 1822 District 13
- PA US Congress 1822 District 14
- PA US Congress 1822 District 15
- PA US Congress 1822 District 16
- PA US Congress 1822 District 17
- PA US Congress 1822 District 18
Legend
Related Maps
How to Read This Map
Four steps to get started.Citation
“18th Congress: Pennsylvania 1822,” Mapping Early American Elections, https://earlyamericanelections.org/maps/meae.congressional.congress18.pa.county.html