9th Congress: Pennsylvania 1804
This page includes an interactive map. A text version of the same election data is available in the table below the map.
Pennsylvania elected one Federalist and seventeen Democratic-Republicans to the Ninth Congress.
Pennsylvania used a district system for electing members to Congress. Each district elected one member of Congress except District 4, which elected two members, and Districts 1, 2, and 3, which each elected three members. The votes cast in Erie, Mercer, Venango, and Warren counties are included in the Crawford County totals.
In 1805, a special election was held in which Democratic-Republican Robert Whitehill was elected to replace J. A. Hanna, who died while in office.
In 1805, a special election was held in which Democratic-Republican Samuel Smith was elected to replace John B. C. Lucas, who had resigned from office.
In 1806, a special election was held in which Democratic-Republican John Porter was elected to replace Michael Leib, who had resigned from office.
| District | Candidate | Party | Vote | Percentage | Elected |
|---|---|---|---|---|---|
| 1 | Joseph Clay | Democratic-Republican | 7,427 | 33.6% | ✓ |
| 1 | Jacob Richards | Democratic-Republican | 7,021 | 31.7% | ✓ |
| 1 | Michael Leib | Democratic-Republican | 3,992 | 18% | ✓ |
| 1 | William Penrose | Federalist | 3,685 | 16.7% | |
| 2 | John Pugh | Democratic-Republican | 6,701 | 32.1% | ✓ |
| 2 | Frederick Conrad | Democratic-Republican | 6,596 | 31.6% | ✓ |
| 2 | Robert Brown | Democratic-Republican | 4,532 | 21.7% | ✓ |
| 2 | John Ross | Republican Faction | 2,710 | 13% | |
| 3 | Christian Lower | Democratic-Republican | 9,079 | 33.2% | ✓ |
| 3 | John Whitehill | Democratic-Republican | 6,309 | 23.1% | ✓ |
| 3 | Isaac Anderson | Democratic-Republican | 6,287 | 23% | ✓ |
| 3 | Thomas Boude | Federalist | 2,829 | 10.4% | |
| 3 | Isaac Wayne | Federalist | 2,814 | 10.3% | |
| 4 | David Bard | Democratic-Republican | 3,247 | 34.6% | ✓ |
| 4 | John A. Hanna | Democratic-Republican | 3,031 | 32.3% | ✓ |
| 4 | Oliver Pollack | Democratic-Republican | 1,600 | 17% | |
| 4 | Robert Whitehill | Democratic-Republican | 1,514 | 16.1% | |
| 5 | Andrew Gregg | Democratic-Republican | 3,318 | unopposed | ✓ |
| 6 | James Kelly | Federalist | 1,705 | 58.5% | ✓ |
| 6 | John Stewart | Democratic-Republican | 1,211 | 41.5% | |
| 7 | John Rea | Democratic-Republican | 1,494 | 99.6% | ✓ |
| 8 | William Findley | Democratic-Republican | ✓ | ||
| 9 | John Smilie | Democratic-Republican | unopposed | ✓ | |
| 10 | John Hamilton | Democratic-Republican | 868 | 100% | ✓ |
| 11 | John B. Lucas | Democratic-Republican | 2,526 | 64.8% | ✓ |
| 11 | James O’Hara | Federalist | 1,373 | 35.2% |
In most cases, only candidates who received more than 5 percent of the vote in a district are reported. Other candidates are reported as a group, but only if they in aggregate received more than 5 percent of the vote. In addition, percentages for each district may not add up to 100 percent due to rounding. The term Dissenting Republican includes various breakaway factions of the Democratic-Republican party.
New Nation Votes Data
- PA US Congress 1804 District 1
- PA US Congress 1804 District 2
- PA US Congress 1804 District 3
- PA US Congress 1804 District 4
- PA US Congress 1804 District 5
- PA US Congress 1804 District 6
- PA US Congress 1804 District 7
- PA US Congress 1804 District 8
- PA US Congress 1804 District 9
- PA US Congress 1804 District 10
- PA US Congress 1804 District 11
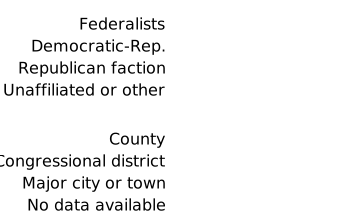
Legend
Related Maps
How to Read This Map
Four steps to get started.Citation
“9th Congress: Pennsylvania 1804,” Mapping Early American Elections, https://earlyamericanelections.org/maps/meae.congressional.congress09.pa.county.html