15th Congress: New York 1816
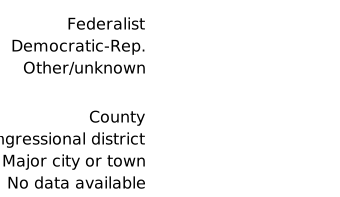
This page includes an interactive map. A text version of the same election data is available in the table below the map.
New York elected five Federalists and twenty-two Democratic-Republicans to the Fifteenth Congress.
New York used a district system for electing members to Congress. Each district elected one member of Congress, except Districts 1, 2, 12, 15, 20, and 21, which each elected two members.
In 1817, a special election was held in which James Tallmadge, Jr. was elected to replace Henry B. Lee, who had died.
| District | Candidate | Party | Vote | Percentage | Elected |
|---|---|---|---|---|---|
| 1 | George Townsend | Democratic-Republican | 3,798 | 26.9% | ✓ |
| 1 | Tredwell Scudder | Democratic-Republican | 3,781 | 26.7% | ✓ |
| 1 | Nathaniel Smith | Federalist | 3,268 | 23.1% | |
| 1 | Samuel Jones, Jr. | Federalist | 3,267 | 23.1% | |
| 2 | William Irving | Democratic-Republican | 5,225 | 29% | ✓ |
| 2 | Peter H. Wendover | Democratic-Republican | 5,199 | 28.9% | ✓ |
| 2 | Josiah Hoffman | Federalist | 3,792 | 21.1% | |
| 2 | Isaac Ely | Federalist | 3,771 | 20.9% | |
| 3 | Caleb Tompkins | Democratic-Republican | 1,787 | 56.7% | ✓ |
| 3 | Abraham Odell | Federalist | 1,347 | 42.7% | |
| 4 | Henry B. Lee | Democratic-Republican | 2,530 | 52.6% | ✓ |
| 4 | Henry A. Livingston | Federalist | 2,271 | 47.2% | |
| 5 | Philip Schuyler | Federalist | 3,154 | 58.8% | ✓ |
| 5 | James Van Alen | Democratic-Republican | 2,198 | 41% | |
| 6 | James W. Wilkin | Democratic-Republican | 1,613 | 55.5% | ✓ |
| 6 | James Burt | Federalist | 1,295 | 44.5% | |
| 7 | Josiah Hasbrouck | Democratic-Republican | 1,826 | 51.7% | ✓ |
| 7 | John Sudam | Federalist | 1,703 | 48.2% | |
| 8 | Dorrance Kirtland | Democratic-Republican | 2,372 | 55.5% | ✓ |
| 8 | Samuel Sherwood | Federalist | 1,902 | 44.5% | |
| 9 | Rensseler Westerloo | Federalist | 2,180 | 56.1% | ✓ |
| 9 | Elisha Jenkins | Democratic-Republican | 1,424 | 36.7% | |
| 9 | John Lovett | Federalist | 277 | 7.1% | |
| 10 | John P. Cushman | Federalist | 2,573 | 54.9% | ✓ |
| 10 | Thomas Turner | Democratic-Republican | 2,107 | 44.9% | |
| 11 | John W. Taylor | Democratic-Republican | 1,804 | 53.5% | ✓ |
| 11 | Elisha Powell | Federalist | 1,564 | 46.4% | |
| 12 | John Palmer | Democratic-Republican | 4,713 | 26.9% | ✓ |
| 12 | John Savage | Democratic-Republican | 4,597 | 26.2% | ✓ |
| 12 | Henry Ross | Federalist | 4,106 | 23.4% | |
| 12 | Zebulon R. Shiperd | Federalist | 4,072 | 23.2% | |
| 13 | Thomas Lawyer | Democratic-Republican | 2,145 | 54.9% | ✓ |
| 13 | William Beekman | Federalist | 1,763 | 45.1% | |
| 14 | John Herkimer | Democratic-Republican | 2,579 | 50.8% | ✓ |
| 14 | Richard Van Horn | Federalist | 2,495 | 49.2% | |
| 15 | Isaac Williams | Democratic-Republican | 5,027 | 26.6% | ✓ |
| 15 | John Drake | Democratic-Republican | 5,019 | 26.5% | ✓ |
| 15 | James Clapp | Federalist | 4,416 | 23.4% | |
| 15 | James Hyde | Federalist | 4,416 | 23.4% | |
| 16 | Henry R. Storrs | Federalist | 2,818 | 52.2% | ✓ |
| 16 | Nathan Williams | Democratic-Republican | 2,540 | 47.1% | |
| 17 | Thomas H. Hubbard | Democratic-Republican | 3,128 | 51.4% | ✓ |
| 17 | Simeon Ford | Federalist | 2,938 | 48.3% | |
| 18 | David A. Ogden | Federalist | 2,391 | 50.4% | ✓ |
| 18 | Ela Collins | Democratic-Republican | 2,349 | 49.5% | |
| 19 | James Porter | Democratic-Republican | 2,789 | 55.2% | ✓ |
| 19 | James Geddes | Federalist | 2,244 | 44.4% | |
| 20 | Daniel Cruger | Democratic-Republican | 6,361 | 35.4% | ✓ |
| 20 | Oliver Comstock | Democratic-Republican | 5,142 | 28.6% | ✓ |
| 20 | Elijah Miller | Federalist | 2,597 | 14.5% | |
| 20 | Benjamin Johnson | Federalist | 1,814 | 10.1% | |
| 20 | Enos T. Throop | Democratic-Republican | 1,271 | 7.1% | |
| 21 | Benjamin Ellicott | Democratic-Republican | 8,794 | 29.4% | ✓ |
| 21 | John C. Spencer | Democratic-Republican | 8,053 | 26.9% | ✓ |
| 21 | Philip Church | Federalist | 6,152 | 20.6% | |
| 21 | Graham Newell | Federalist | 6,071 | 20.3% |
In most cases, only candidates who received more than 5 percent of the vote in a district are reported. Other candidates are reported as a group, but only if they in aggregate received more than 5 percent of the vote. In addition, percentages for each district may not add up to 100 percent due to rounding. The term Dissenting Republican includes various breakaway factions of the Democratic-Republican party.
New Nation Votes Data
- NY US Congress 1816 District 1
- NY US Congress 1816 District 2
- NY US Congress 1816 District 3
- NY US Congress 1816 District 4
- NY US Congress 1816 District 5
- NY US Congress 1816 District 6
- NY US Congress 1816 District 7
- NY US Congress 1816 District 8
- NY US Congress 1816 District 9
- NY US Congress 1816 District 10
- NY US Congress 1816 District 11
- NY US Congress 1816 District 12
- NY US Congress 1816 District 13
- NY US Congress 1816 District 14
- NY US Congress 1816 District 15
- NY US Congress 1816 District 16
- NY US Congress 1816 District 17
- NY US Congress 1816 District 18
- NY US Congress 1816 District 19
- NY US Congress 1816 District 20
- NY US Congress 1816 District 21
Legend
Related Maps
How to Read This Map
Four steps to get started.Citation
“15th Congress: New York 1816,” Mapping Early American Elections, https://earlyamericanelections.org/maps/meae.congressional.congress15.ny.county.html