11th Congress: New York 1808
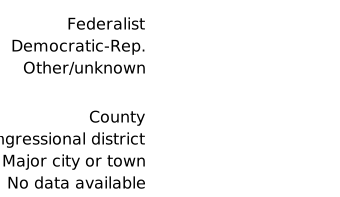
This page includes an interactive map. A text version of the same election data is available in the table below the map.
New York elected eight Federalists and nine Democratic-Republicans to the Eleventh Congress.
New York used a district system for electing members to Congress. Each district elected one member of Congress except Districts 2 and 6, which each elected two members.
In 1810, a special election was held in which Democratic-Republican Samuel L. Mitchell was elected to replace William Denning, who had resigned from office.
| District | Candidate | Party | Vote | Percentage | Elected |
|---|---|---|---|---|---|
| 1 | Ebenezer Sage | Democratic-Republican | 1,645 | 38.7% | ✓ |
| 1 | Benjamin B. Blydenburgh | Federalist | 1,627 | 38.3% | |
| 1 | John W. Seaman | Democratic-Republican | 975 | 22.9% | |
| 2 | William Denning | Democratic-Republican | 6,203 | 28.5% | ✓ |
| 2 | Gurdon S. Mumford | Democratic-Republican | 6,185 | 28.4% | ✓ |
| 2 | William Henderson | Federalist | 4,667 | 21.5% | |
| 2 | Barent Gardenier | Federalist | 4,660 | 21.4% | |
| 3 | Jonathan Fisk | Democratic-Republican | 2,422 | 52.6% | ✓ |
| 3 | Richard Hatfield | Federalist | 2,123 | 46.1% | |
| 4 | James Emott | Federalist | 1,606 | 73% | ✓ |
| 4 | Robert Johnson | Democratic-Republican | 556 | 25.3% | |
| 5 | Barent Gardenier | Federalist | 2,677 | 56.3% | ✓ |
| 5 | John Dill | Democratic-Republican | 2,059 | 43.3% | |
| 6 | Herman Knickerbacker | Federalist | 6,471 | 26.1% | ✓ |
| 6 | Robert LeRoy Livingston | Federalist | 6,432 | 26% | ✓ |
| 6 | James J. Van Alen | Democratic-Republican | 5,922 | 23.9% | |
| 6 | James L. Hogeboom | Democratic-Republican | 5,903 | 23.8% | |
| 7 | Killian K. Van Rensselaer | Federalist | 2,685 | 65.1% | ✓ |
| 7 | George Merchant | Democratic-Republican | 1,437 | 34.8% | |
| 8 | John Thompson | Democratic-Republican | 2,488 | 64.2% | ✓ |
| 8 | William Bailey | Federalist | 1,305 | 33.7% | |
| 9 | Thomas Sammons | Federalist | 3,642 | 63.2% | ✓ |
| 9 | John Herkimer | Democratic-Republican | 2,116 | 36.7% | |
| 10 | John Nicholson | Democratic-Republican | 2,352 | 52.7% | ✓ |
| 10 | Moss Kent | Federalist | 2,019 | 45.2% | |
| 11 | Thomas R. Gold | Federalist | 3,821 | 55.6% | ✓ |
| 11 | Joshua Hatheway | Democratic-Republican | 2,959 | 43.1% | |
| 12 | Erastus Root | Democratic-Republican | 2,205 | 49.3% | ✓ |
| 12 | Gabriel North | Federalist | 1,634 | 36.6% | |
| 12 | Ebenezer Foote | Federalist | 619 | 13.8% | |
| 13 | Uri Tracy | Democratic-Republican | 3,229 | 68.6% | ✓ |
| 13 | Isaac Foote | Federalist | 941 | 20% | |
| 13 | Vincent Mathews | Federalist | 494 | 10.5% | |
| 14 | Vincent Matthews | Federalist | 1,877 | 39.9% | ✓ |
| 14 | John Harris | Democratic-Republican | 1,163 | 24.7% | |
| 14 | Matthew Carpenter | Democratic-Republican | 978 | 20.8% | |
| 14 | Joseph Glover | Democratic-Republican | 649 | 13.8% | |
| 15 | Peter B. Porter | Democratic-Republican | ✓ |
In most cases, only candidates who received more than 5 percent of the vote in a district are reported. Other candidates are reported as a group, but only if they in aggregate received more than 5 percent of the vote. In addition, percentages for each district may not add up to 100 percent due to rounding. The term Dissenting Republican includes various breakaway factions of the Democratic-Republican party.
New Nation Votes Data
- NY US Congress 1808 District 1
- NY US Congress 1808 District 2
- NY US Congress 1808 District 3
- NY US Congress 1808 District 4
- NY US Congress 1808 District 5
- NY US Congress 1808 District 6
- NY US Congress 1808 District 7
- NY US Congress 1808 District 8
- NY US Congress 1808 District 9
- NY US Congress 1808 District 10
- NY US Congress 1808 District 11
- NY US Congress 1808 District 12
- NY US Congress 1808 District 13
- NY US Congress 1808 District 14
- NY US Congress 1808 District 15
Legend
Related Maps
How to Read This Map
Four steps to get started.Citation
“11th Congress: New York 1808,” Mapping Early American Elections, https://earlyamericanelections.org/maps/meae.congressional.congress11.ny.county.html