6th Congress: Pennsylvania 1798
This page includes an interactive map. A text version of the same election data is available in the table below the map.
Pennsylvania elected five Federalists and eight Democratic-Republicans to the Sixth Congress.
Pennsylvania continued to use a district system for electing members to Congress. Each district elected one member of Congress except District 4, which elected two members.
| District | Candidate | Party | Vote | Percentage | Elected |
|---|---|---|---|---|---|
| 1 | Robert Waln | Federalist | 865 | 70% | ✓ |
| 1 | Samuel Miles | Democratic-Republican | 371 | 30% | |
| 2 | Michael Leib | Democratic-Republican | 1,129 | 56.5% | ✓ |
| 2 | Anthony Morris | Federalist | 870 | 43.5% | |
| 3 | Richard Thomas | Federalist | 3,760 | 71.3% | ✓ |
| 3 | John Pearson | Democratic-Republican | 1,514 | 28.7% | |
| 4 | Robert Brown | Democratic-Republican | 5,372 | 31.1% | ✓ |
| 4 | Peter Muhlenberg | Democratic-Republican | 4,935 | 28.6% | ✓ |
| 4 | John Chapman | Federalist | 3,605 | 20.9% | |
| 4 | Jacob Eyerly | Federalist | 3,288 | 19% | |
| 5 | Joseph Heister | Democratic-Republican | 3,461 | 69.9% | ✓ |
| 5 | Daniel Clymer | Federalist | 1,492 | 30.1% | |
| 6 | John A. Hanna | Democratic-Republican | 3,052 | 66.3% | ✓ |
| 6 | Daniel Smith | Federalist | 1,554 | 33.7% | |
| 7 | John W. Kittera | Federalist | 1,403 | 77.5% | ✓ |
| 7 | William Barton | Democratic-Republican | 407 | 22.5% | |
| 8 | Thomas Hartley | Federalist | 3,857 | 85.4% | ✓ |
| 8 | Henry Slagle | Democratic-Republican | 659 | 14.6% | |
| 9 | Andrew Gregg | Democratic-Republican | 2,618 | 57.8% | ✓ |
| 9 | James Armstrong | Federalist | 1,912 | 42.2% | |
| 10 | Henry Woods | Federalist | 2,546 | 53.7% | ✓ |
| 10 | Thomas Johnston | Federalist | 1,228 | 25.9% | |
| 10 | David Bard | Democratic-Republican | 968 | 20.4% | |
| 11 | John Smilie | Democratic-Republican | 1,782 | 46% | ✓ |
| 11 | William Todd | Federalist | 1,265 | 32.7% | |
| 11 | James Guthrie | Federalist | 826 | 21.3% | |
| 12 | Albert Gallatin | Democratic-Republican | 3,926 | 58.9% | ✓ |
| 12 | John Woods | Federalist | 2,741 | 41.1% |
In most cases, only candidates who received more than 5 percent of the vote in a district are reported. Other candidates are reported as a group, but only if they in aggregate received more than 5 percent of the vote. In addition, percentages for each district may not add up to 100 percent due to rounding. The term Dissenting Republican includes various breakaway factions of the Democratic-Republican party.
New Nation Votes Data
- PA US Congress 1798 District 1
- PA US Congress 1798 District 2
- PA US Congress 1798 District 3
- PA US Congress 1798 District 4
- PA US Congress 1798 District 5
- PA US Congress 1798 District 6
- PA US Congress 1798 District 7
- PA US Congress 1798 District 8
- PA US Congress 1798 District 9
- PA US Congress 1798 District 10
- PA US Congress 1798 District 11
- PA US Congress 1798 District 12
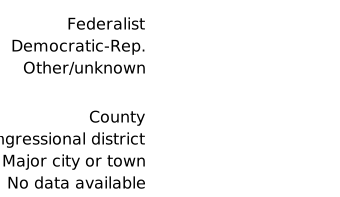
Legend
Related Maps
How to Read This Map
Four steps to get started.Citation
“6th Congress: Pennsylvania 1798,” Mapping Early American Elections, https://earlyamericanelections.org/maps/meae.congressional.congress06.pa.county.html