Mapping Congress in the Era of the First Party System
November 6, 2018As Americans go to the polls to vote for their representatives to Congress on Election Day, the Mapping Early American Elections team invites you to examine maps from the first four decades of Congressional elections. In addition to the maps of the first ten Congresses we released previously, today we are releasing maps of 24 states for elections to the 11th through 19th Congresses. This release completes our run of state-by-state maps of county-level returns for elections to the House of Representatives.
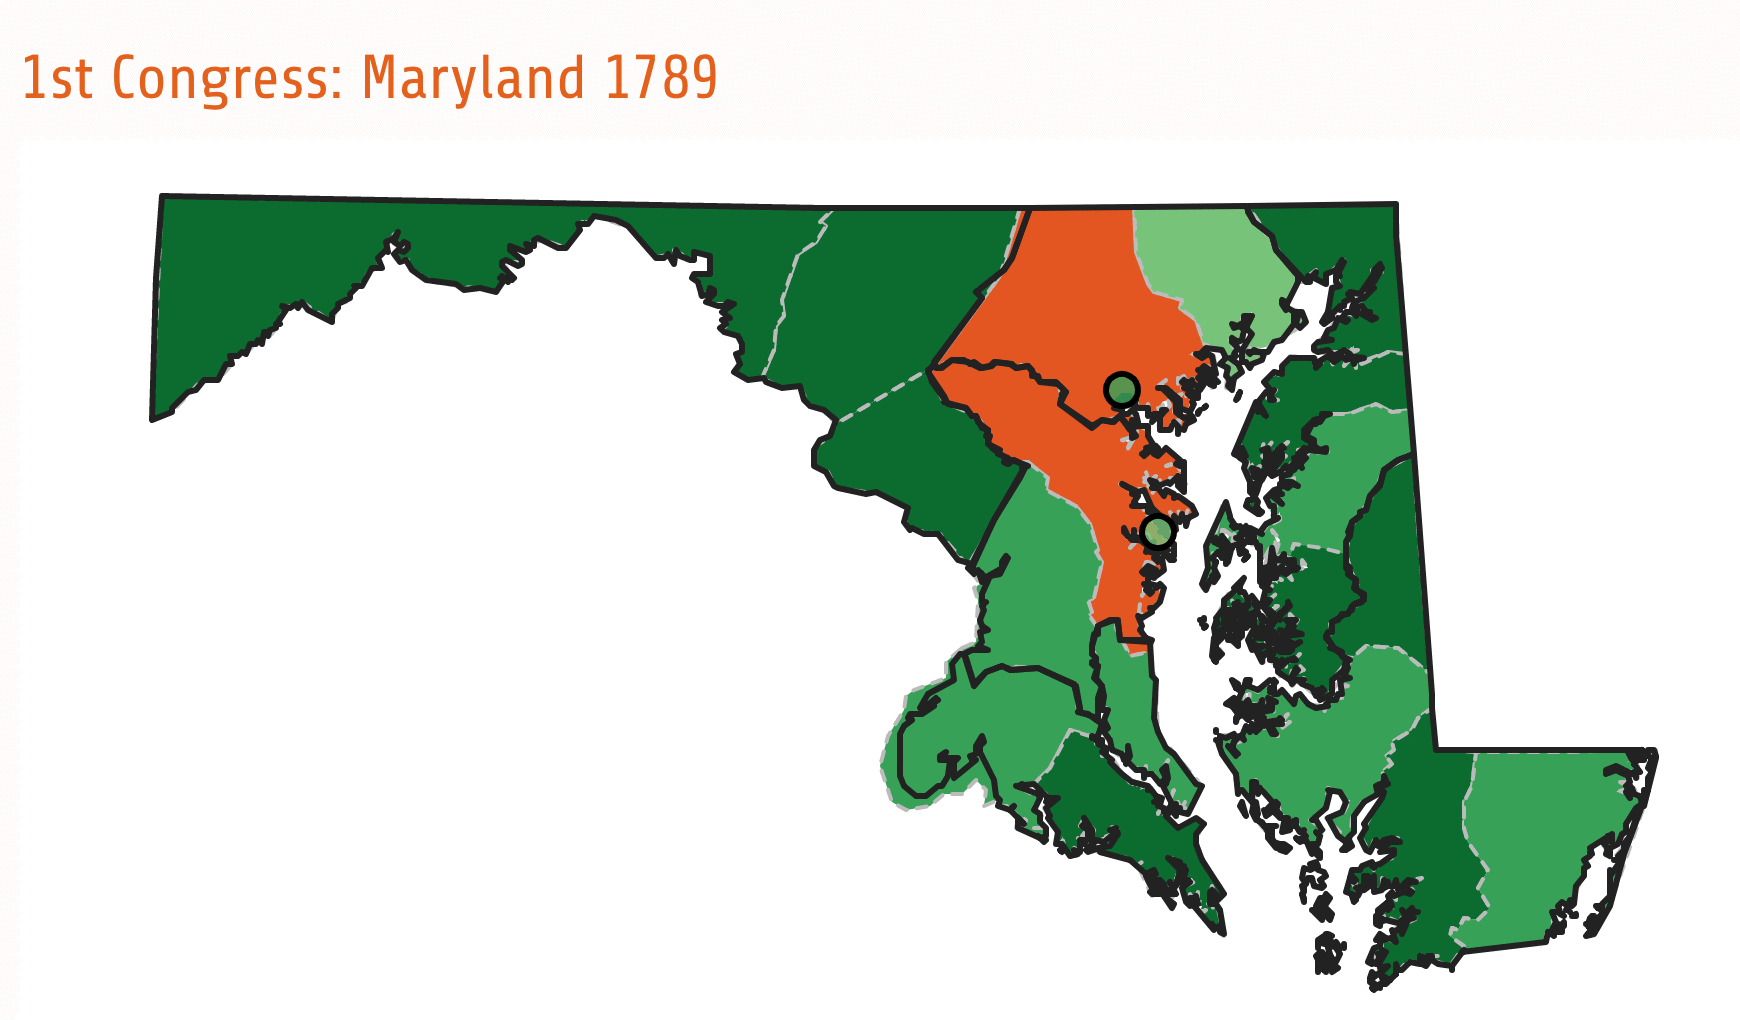
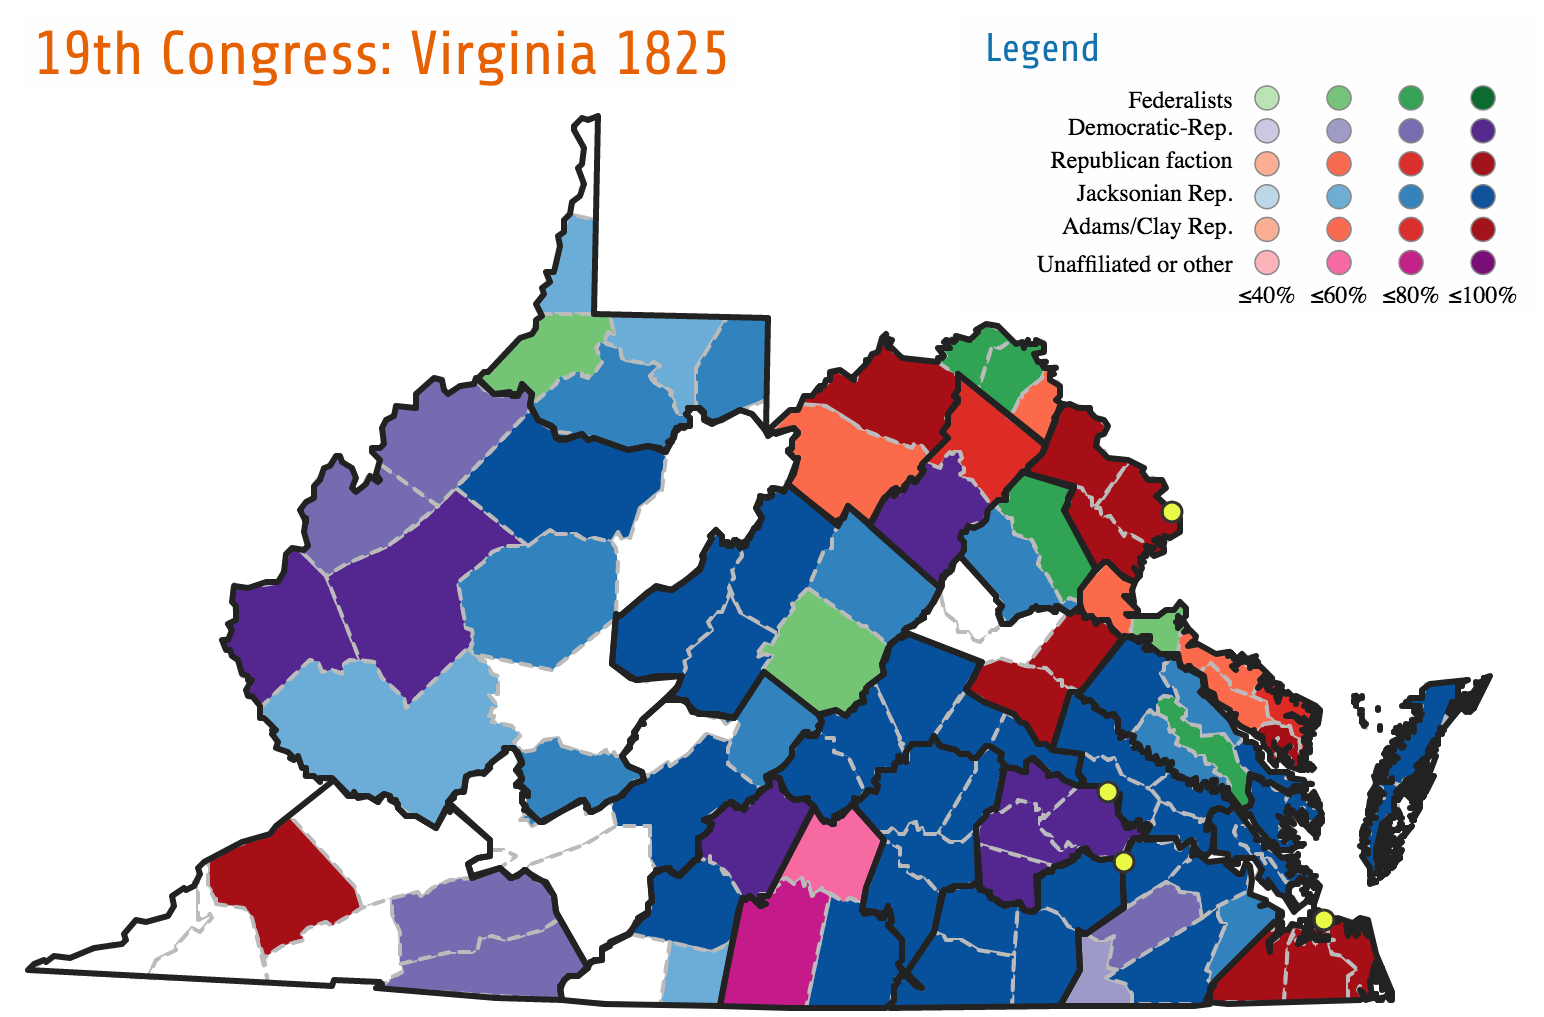
These maps constitute a detailed visualization of Congressional elections, which we have mapped at the county level rather than at the level of the district or state. While signficant gaps remain, these maps are as comprehensive as possible for this period. Data on Congressional elections becomes far more available and reliable after 1824. Indeed, election data before 1824 would have been virtually lost, were it not for the decades of labor by Philip Lampi and the A New Nation Votes project. While our maps are based on the NNV data, we have also created what amounts to a new dataset in order to be able to map these election returns. This has included figuring out missing data by estimating returns at the county level from district totals, associating the elections data with the spatial data in the Atlas of Historical County Boundaries and United States Congressional District Shapefiles, creating links to the Biographical Directory of the United States Congress, and identifying party affiliations for many Congressional candidates. We have also had to make many decisions about how to represent political affiliations on the maps, associating candidates not just with the major parties from this period but also with significant factions within those parties.
The period from 1789 to 1824 saw the formation and gradual fragmentation of the first party system. Though political parties were regarded with suspicion in the early republican period, the two-party system came to provide the foundational structure of American politics, with parties playing an essential role in encouraging and channeling participation in American democracy. Political affiliations were initially organized only loosely around coalitions of Federalists and Anti-Federalists. Occasionally local political parties were more significant than those national affiliations. The maps and tables for some of the earlier elections show that many representatives (for example, in Virginia) stood for election without opposition, a remnant of an older political system organized around “natural leaders” from the gentry rather than around party competition.
By the early years of the nineteenth-century, those coalitions had turned into two recognizable political parties, the Federalists and the Democratic-Republicans. While the Federalists remained a significant political power in many locations for longer than political historians had earlier realized, by the 1820s the Democratic-Republicans had become dominant. For the 18th and 19th Congresses, competition was primarily among factions within that party, rather than between the two political parties. On these maps we have had to represent not just the major parties but also coalitions within the Democratic-Republicans including the Tertium Quids and factions organized around Andrew Jackson, Henry Clay, John Quincy Adams, William Crawford, and DeWitt Clinton. In the elections that followed our period, those factions would eventually coalesce into the second party system, comprised of Democrats and Whigs. (If you want to see how the rest of the history played out, we encourage you to look at Electing the House of Representatives from the Digital Scholarship Lab, which begins mapping elections in 1840.)
We hope that you will browse these maps, perhaps by looking at how elections played out in the county where you vote. These maps show the creation of one of the fundamental structures of U.S. politics and American democracy.
