Mapping the Second Decade of Congressional Elections
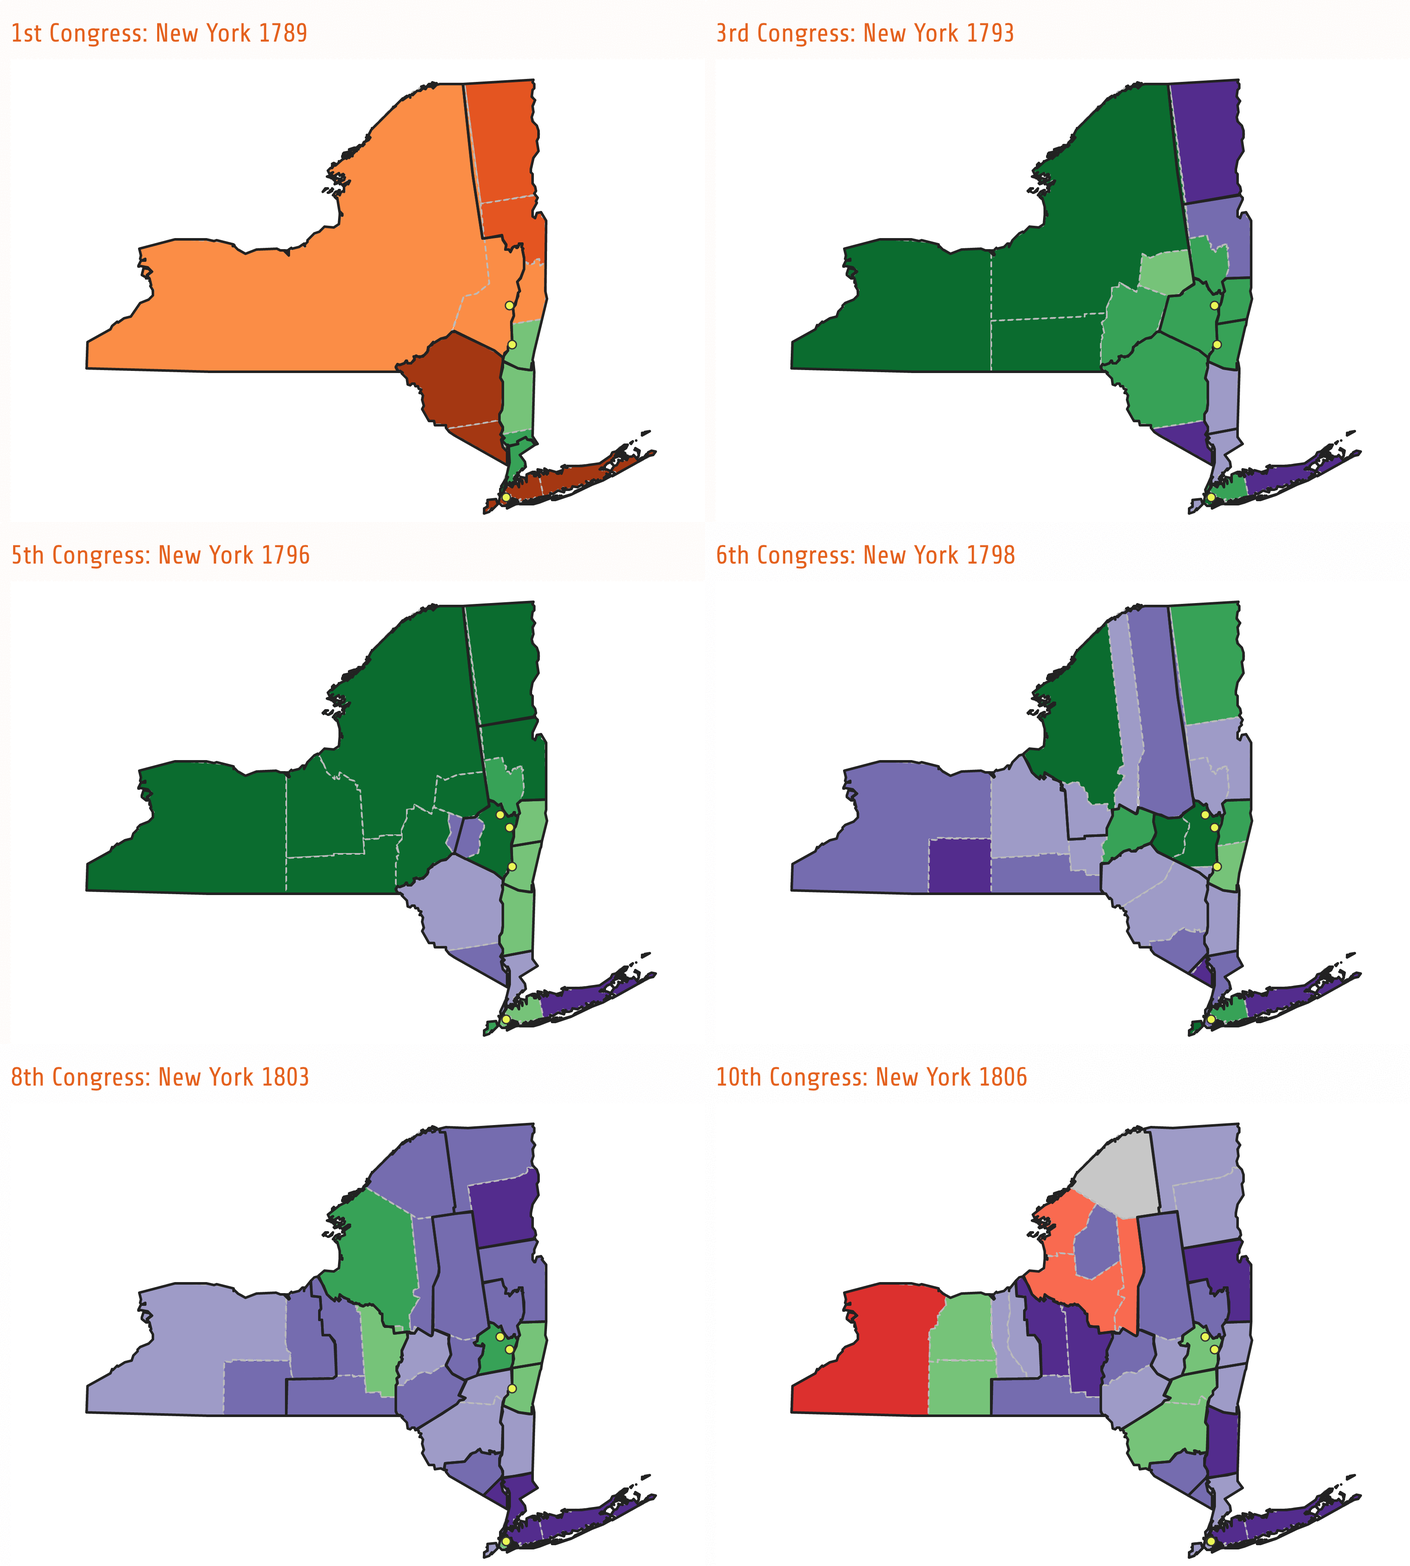
April 17, 2018The Mapping Early American Elections team has released over eighty maps of elections for Congress’s second decade. This release adds county-level maps of election returns for the Sixth through Tenth Congresses, taking our coverage of Congressional elections up through the 1806–1807 elections. As before, these maps are accompanied by tables that succinctly summarize the results for each district or state-wide at-large election, and which link out to the Biographical Directory of the United States Congress. Besides examining our maps, you can use the data that underlies them by downloading it from our data repository.

The period covered by these new maps was pivotal to early American democracy. The period saw a general transition, in both Congress and in the presidency, from Federalist to Democratic-Republican majorities. These changes are reflected in the maps, which show the increasing electoral power of the Democratic-Republicans distributed across space. At the basic level of how elections were administered, it was during this decade that a number of states gave up their experimental systems of apportioning representatives and settled on the one representative per district system which is familiar today. This had the effect of making elections turn on local rather than state-wide majorities, and so it preserved Federalist representation in some districts which otherwise would have been swamped under state-wide Democratic-Republican majorities. Breakaway Democratic-Republican groups, whom we have grouped under the heading Dissenting Republicans, began to stand for elections against party favorites. The most important of these groups were the Tertium Quids (or just Quids), a coalition of moderate Democratic-Republicans and Federalists. The Quids narrowly lost some elections and won others, for example, in Virginia in the Ninth Congress and Pennsylvania in the Tenth Congress. Their local prominence is likewise reflected in these maps.
While these maps are the result of the work of the entire project team, two people in particular undertook painstaking labor to prepare them. Jordan Bratt, a PhD student in the Department of History and Art History at George Mason University, continues to work on converting, correcting, and filling the data from A New Nation Votes to make it suitable for mapping. Danny Kim, an undergraduate at GMU, has joined the project in the past few months and has also been checking and preparing the data.
Please take some time to browse these maps that uncover voting patterns in the pivotal second decade of early American elections.


