7th Congress: New Jersey 1800
This page includes an interactive map. A text version of the same election data is available in the table below the map.
New Jersey elected five Democratic-Republicans to the Seventh Congress.
New Jersey switched back to an at-large system for electing members to Congress.
| District | Candidate | Party | Vote | Percentage | Elected |
|---|---|---|---|---|---|
| At-large | James Mott | Democratic-Republican | 14,726 | 10.2% | ✓ Elected |
| At-large | Ebenezer Elmer | Democratic-Republican | 14,637 | 10.2% | ✓ Elected |
| At-large | John Condit | Democratic-Republican | 14,614 | 10.2% | ✓ Elected |
| At-large | William Helms | Democratic-Republican | 14,602 | 10.2% | ✓ Elected |
| At-large | Henry Southard | Democratic-Republican | 14,547 | 10.1% | ✓ Elected |
| At-large | Aaron Ogden | Federalist | 14,177 | 9.9% | Not elected |
| At-large | Peter D. Vroom | Federalist | 14,118 | 9.8% | Not elected |
| At-large | James H. Imlay | Federalist | 14,106 | 9.8% | Not elected |
| At-large | Franklin Davenport | Federalist | 14,037 | 9.8% | Not elected |
| At-large | William Coxe | Federalist | 14,026 | 9.8% | Not elected |
In most cases, only candidates who received more than 5 percent of the vote in a district are reported. Other candidates are reported as a group, but only if they in aggregate received more than 5 percent of the vote. In addition, percentages for each district may not add up to 100 percent due to rounding. The term Dissenting Republican includes various breakaway factions of the Democratic-Republican party.
New Nation Votes Data
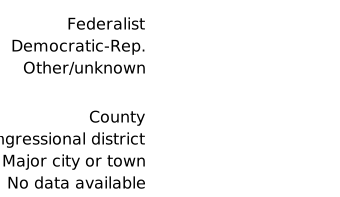
Legend
Related Maps
How to Read This Map
Four steps to get started.Citation
“7th Congress: New Jersey 1800,” Mapping Early American Elections, https://earlyamericanelections.org/maps/meae.congressional.congress07.nj.county.html