How Mapping Elections Is Different From A New Nation Votes
April 19, 2017Mapping Early American Elections is based on the records collected in an earlier project, A New Nation Votes (also funded by the NEH). This project has been providing scholars with access to election returns from the early republic for a number of years. So what exactly is our project adding to these election returns, and how is it making them more accessible?
The best way to understand the difference between the two projects is that A New Nation Votes is a transcription of election returns, while Mapping Elections is a dataset. NNV provides researchers with access to the details of individual elections. Mapping Elections, on the other hand, will give scholars a way to see American elections as a whole through maps and other kinds of analysis. In order to provide that kind of overview, we are improving these sources by turning the transcribed returns into a dataset and connecting that dataset to geographic data.
Thanks to the painstaking efforts of Philip Lampi and then a team at the American Antiquarian Society, the election returns from the early republic have been transcribed from newspaper reports, state and local records, and other sources. Let’s take as an example the 1789 election to the House of Representatives from Virginia’s fifth district. In this election, James Madison defeated James Monroe with 57 percent of the vote. Visiting the New Nation Votes listing for this election will show two transcriptions of the election returns. At the bottom of the page are photographs of Philip Lampi’s original notes. The top of the page shows a data table giving the votes for each candidate by county and the total votes for the district as a whole.

That table is actually generated from an XML file, which is the most authoritative version of the transcribed records. You can see the XML file for that election at our mirror of the NNV data. That XML file keeps track of such details as the candidates and their party affiliations, citations to sources, and the votes by county, district, or town. We export the data for Mapping Elections from those XML files.
However, the data on the NNV website is not immediately ready to be mapped. We can leave aside the fact that the data would have to be transformed from the XML file to some kind of table to create a map. More important are two things that we can observe about the data.
The first is that the data in the table does not add up—literally. The sum of the county level totals for Madison adds up to 1,328 votes in his favor, while the district total is reported as 1,308. For Monroe, the sum of the county votes adds up to 898, while his total for the district is reported as 972. To be clear, this is not an error in the NNV project. Rather, NNV is reporting results from various newspapers. Some of those newspapers reported the votes for the counties; other newspapers reported the results for the district as a whole. NNV is a faithful transcription of those conflicting election returns. The Mapping Early American Elections project is taking that data and resolving such conflicts so that the data can be mapped at several geographic levels.
The second thing that one can notice about the data is that it includes spatial information without giving the user any way to look up the historical boundaries of those places. For example, what were the boundaries of Albemarle County in 1789, or of Virginia’s fifth district in elections for the First Congress?
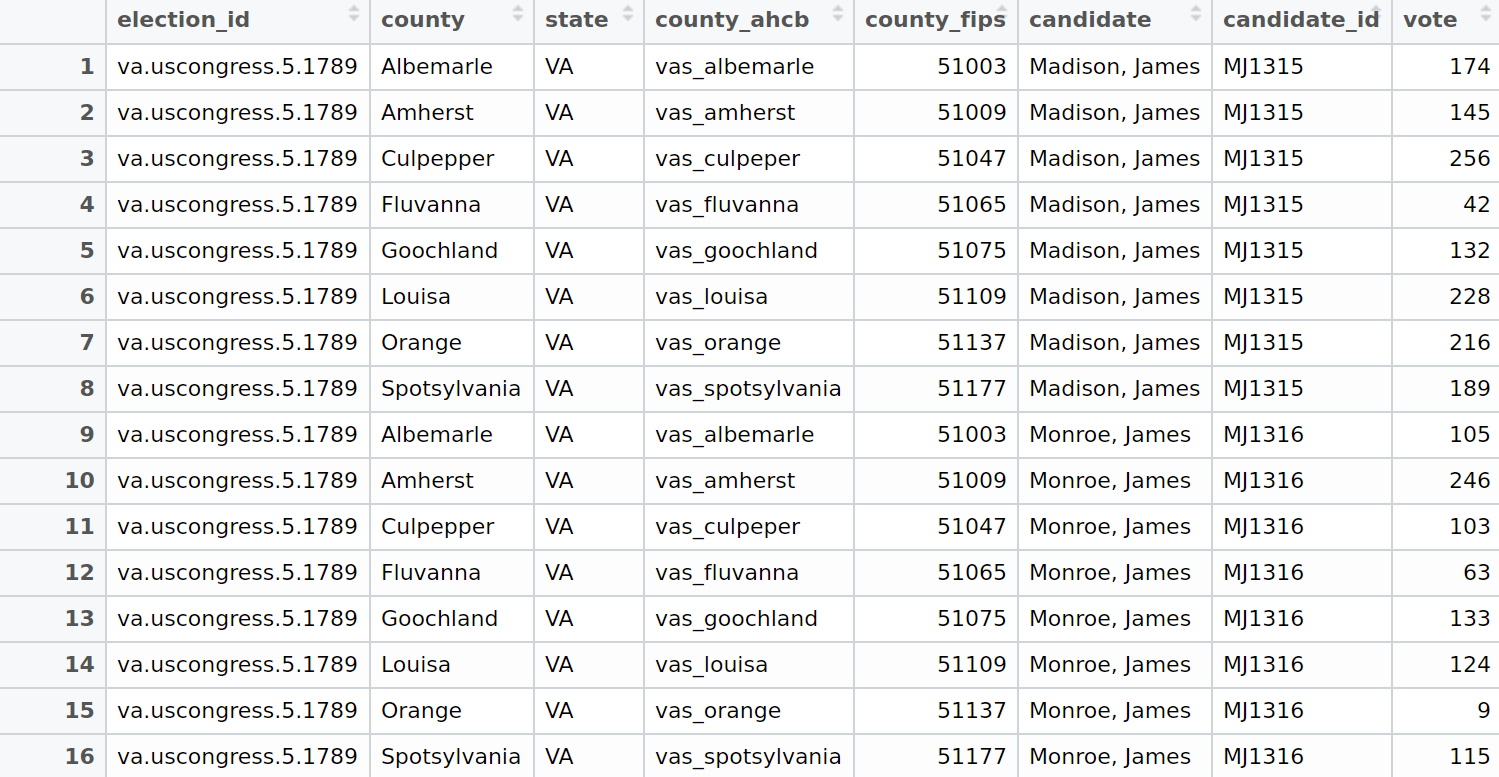
There are several collections of spatial data (cited on our data page) that contain historic boundaries for counties and Congressional districts. These datasets all contain unique identifiers for each boundary. A large part of the work of this project is adding those geographic identifiers to the dataset for towns, counties, and districts. For example, in the table of pre-release data below, the columns county_ahcb and county_fips provide geographic identifiers which allow our data to be joined to the Atlas of Historical County Boundaries.
There are other kinds of work involved in the Mapping Elections project. For example, in addition to providing the basic data, we also intend to provide transformations of the data. For example, from the dataset it is possible to compute not just the candidate vote totals, but the vote percentages by party. Which doing that kind of transformation is not particularly hard, it is perhaps more work than we want to lay on historians who are unfamiliar with working with data. We would like to provide them not just with the maps we are going to create, but data that they can map themselves in as few steps as possible.
So the major difference between these two projects is between a transcription of sources and a dataset. NNV offers a set of transcriptions of election returns in XML files, while Mapping Elections will offer a dataset normalized like a relational database which can in turn be connected to spatial datasets and, for that matter, other datasets such as Census population counts.
