Mapping the First Decade of Congressional Elections
December 13, 2017Districts flip, party affiliations change, and populations and geographies shift. These and other changes are visible in the project’s first release of over 70 maps visualizing county voting returns by state from the first five U.S. Congressional elections. The project will regularly release additional Congressional maps through the nineteenth Congress in early 2018.
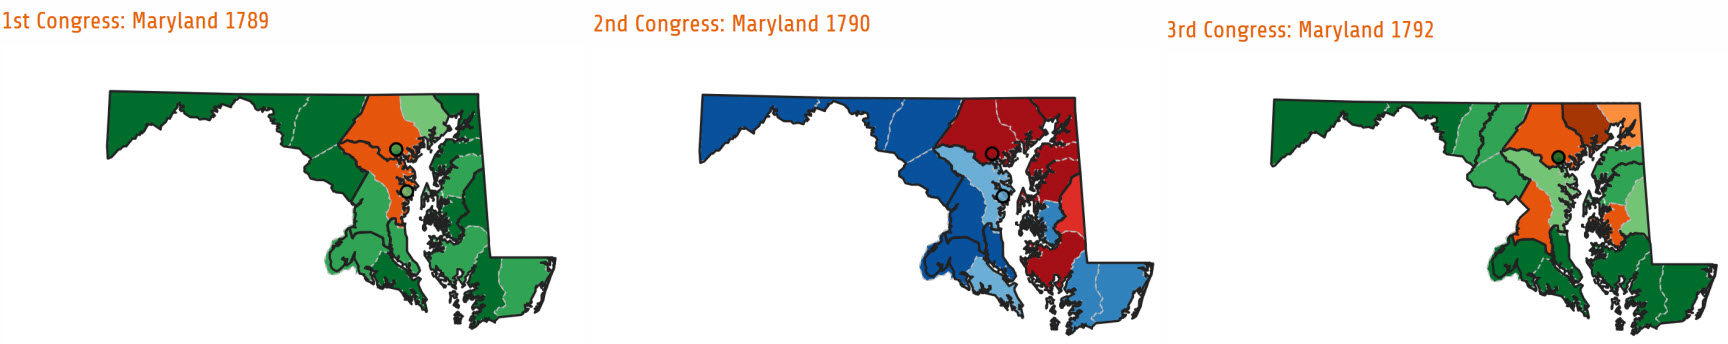
The new Maps section invites users to browse by Congress and state. Some states, like Maryland, saw swings in party affiliations, party competition, and regional voting patterns within the first decade of the United States. Others states, like the solidly Federalist Connecticut, did not.
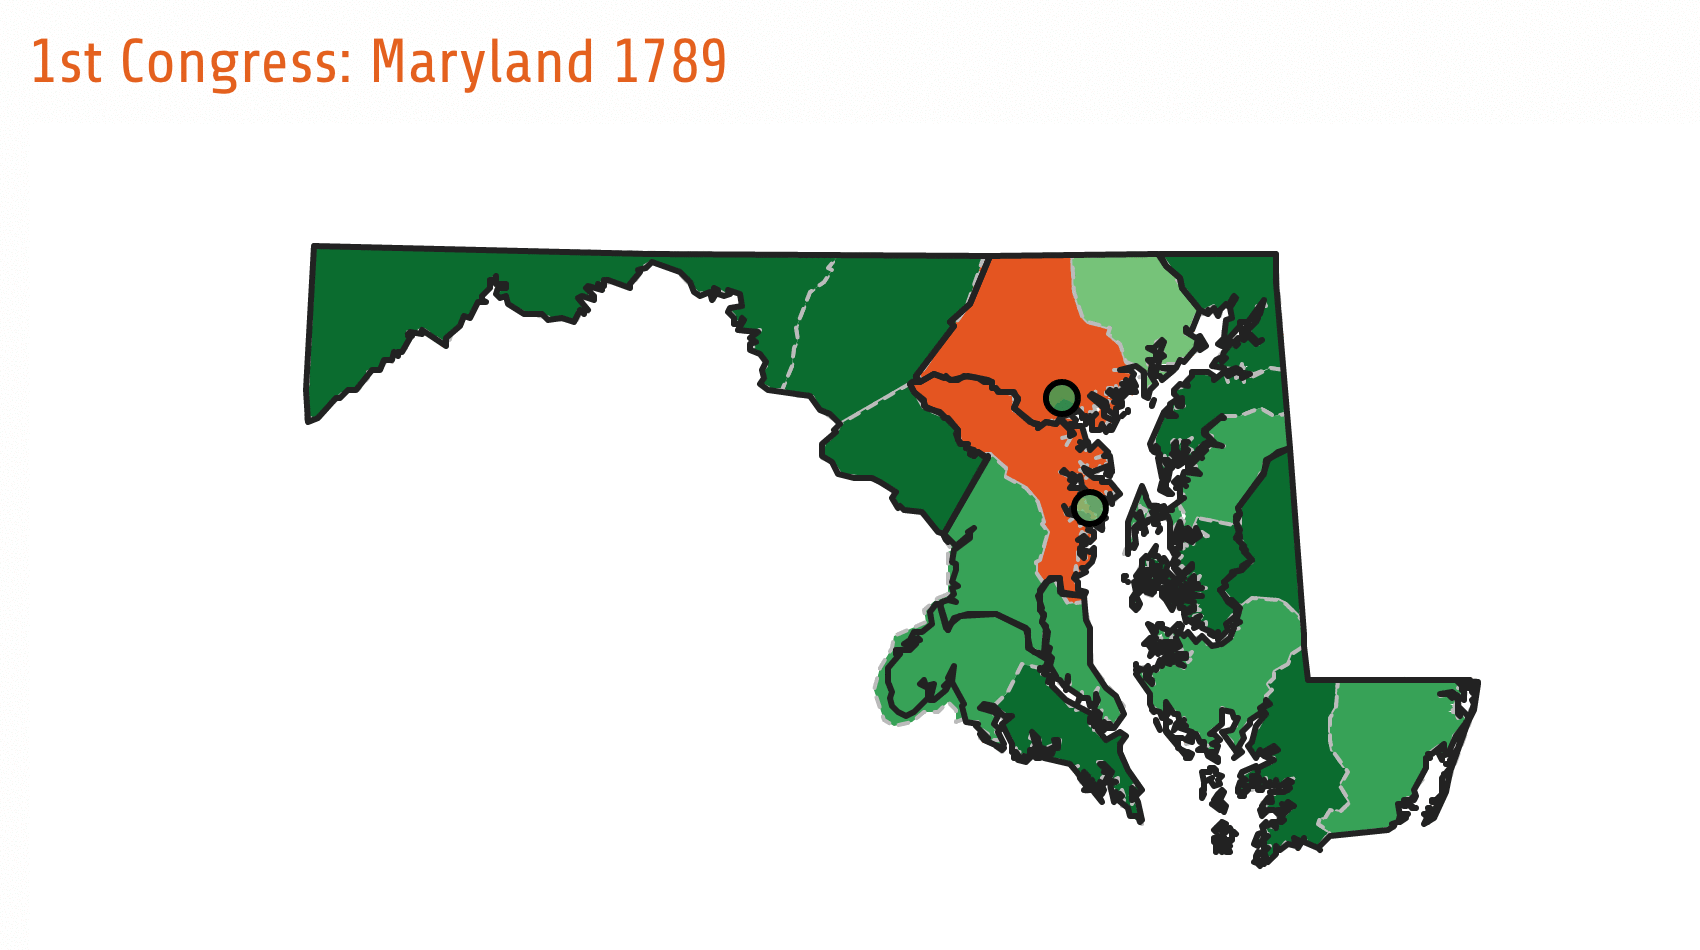
Each map page reveals a state map with the results for a specific Congress, with voting districts and counties outlined that are color-coded to represent the margin of victory. For example, looking at the first election in Maryland, the state elected all Federalists (green) to Congress, even with a strong showing of support for Anti-Federalist (orange) candidates in Baltimore and Anne Arundel Counties. The darker the color, the more votes received by a party in that district. It is then possible for a user to click through to the next Congress, under “Related Maps,” to compare how voting patterns changed from election to election.
Below each map, we provide a table of data that lists election returns by district (or at-large), candidate, party, vote total, percentage of votes earned. To clearly identify the winners, each elected candidate receives a check mark at the end of their row of data. There are cases when a candidate won the election, but did not serve in Congress. For the purposes of this project, we are highlighting who was elected, because our aim is to show what happened in the elections rather than what happened in Congress. For each winner who served in Congress, we provide a link to their entry in the Biographical Directory of the United States Congress.
While this project is based in large part on A New Nation Votes, from which it draws on Philip Lampi’s work collecting elections returns, it also builds up on it. The data has been changed into a tabular form to allow data analysis; we have created the ability to join the elections data to the Atlas of Historical County Boundaries and the Digital Boundary Definitions of United States Congressional Districts, as well as to the Congressional biographies. We have also added missing electoral data. This site features maps of political parties by counties, and will soon add state maps of town data and national maps of Congressional districts. But the data, which is available as it is being developed, allows for many other kinds of maps. We will highlight some of the decisions that went into shaping the data and the ways in which it can be used on our blog.
Making the maps is no easy task. Lincoln Mullen and Jordan Bratt have been working through the data for many months. We are also grateful to project advisors, especially Philip Lampi, who painstakingly reviewed the maps before launch.
The Mapping Early American Elections GitHub project includes the data we have released so far, along with the other code produced by the project. If you are interested in the data repository, you can follow the data preparation progress through commits and issues in GitHub.
Please take some time browse the maps that represent early American voting returns for Congressional elections. What interesting patterns will you find?
